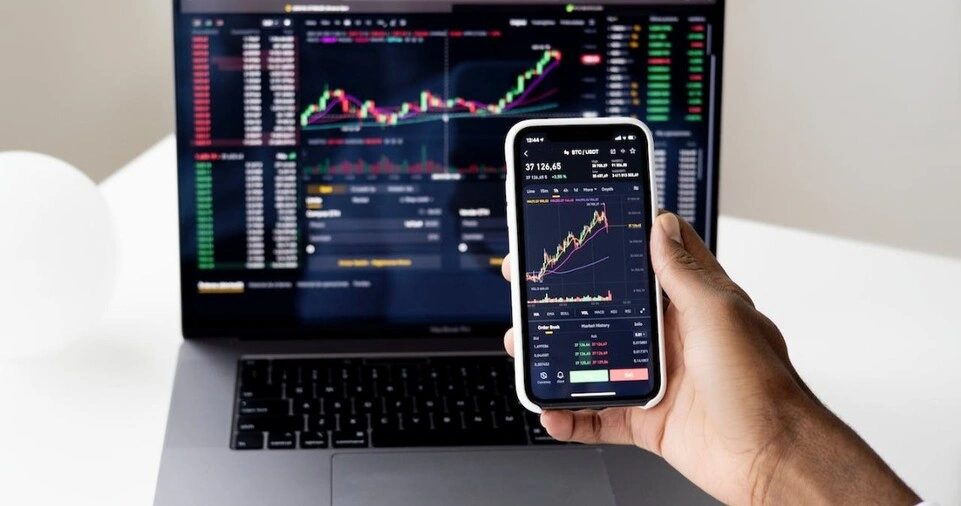
Cryptocurrency trading has grown significantly over the past decade, with millions of traders worldwide leveraging different strategies to maximize their profits.
One of the most widely used methods in crypto trading is technical analysis (TA).
Unlike fundamental analysis, which focuses on a project’s background, partnerships, and adoption, technical analysis is purely based on past price movements, trading volume, and market patterns.
The core idea behind TA is that historical price behavior tends to repeat itself, allowing traders to make informed decisions based on established patterns.
Technical analysis provides traders with insights into market trends, possible price movements, and ideal entry and exit points.
This makes it a crucial tool for both beginner and advanced traders looking to gain an edge in the highly volatile cryptocurrency market.
With the right knowledge and approach, TA can help traders minimize risks, identify profitable trading opportunities, and enhance their overall trading strategy.
In this guide, we will explore the core principles of technical analysis, the best tools and indicators, and how to apply them effectively in cryptocurrency trading.
Understanding Technical Analysis
What is Technical Analysis?
Technical analysis is a trading strategy that involves studying price charts, trading volume, and various indicators to predict future price movements.
Unlike fundamental analysis, which evaluates the intrinsic value of an asset, TA focuses purely on price action and market behavior.
Key Assumptions of Technical Analysis
Technical analysis is based on three primary assumptions:
- Market Prices Reflect All Information – TA assumes that all available market information (news, events, regulations, and fundamentals) is already factored into the price.
- Price Movements Follow Trends – Prices move in trends, meaning they don’t move randomly but follow identifiable patterns over time.
- History Repeats Itself – Market behavior tends to repeat, allowing traders to recognize patterns and use them for predicting future movements.
Choosing the Right Trading Platform
Before applying technical analysis, selecting the right crypto trading platform with advanced charting tools is essential.
Some of the best platforms for technical analysis include:
- TradingView – Offers comprehensive charting tools, customizable indicators, and a user-friendly interface.
- Binance – Features an integrated trading view with multiple indicators and drawing tools.
- Coinbase Pro – Provides basic technical analysis tools suitable for beginners.
- Kraken & Bitfinex – Suitable for professional traders with in-depth analysis tools.
Identifying Market Trends and Chart Patterns
Understanding Trends in Crypto Trading
A trend is the overall direction of price movement over a given period.
There are three main types of trends:
- Uptrend (Bullish Market) – Higher highs and higher lows, indicating rising prices.
- Downtrend (Bearish Market) – Lower highs and lower lows, showing declining prices.
- Sideways (Consolidation Market) – No clear direction, with price moving within a fixed range.
Essential Chart Patterns in Crypto Trading
1. Support & Resistance Levels
- Support is a price level where demand is strong enough to prevent further decline.
- Resistance is a price level where selling pressure prevents further rise.
2. Candlestick Patterns
- Bullish Reversal Patterns – Hammer, Engulfing, Morning Star
- Bearish Reversal Patterns – Shooting Star, Doji, Evening Star
3. Continuation Patterns
- Triangles (Ascending, Descending, and Symmetrical) – Indicate continuation of a trend.
- Flags & Pennants – Short-term continuation patterns seen after strong price movements.
ALSO READ: How to Buy Bitcoin Safely and Securely: A Complete Guide
Using Key Technical Indicators
Moving Averages (MA & EMA)
- Simple Moving Average (SMA) – Calculates the average price over a specific period.
- Exponential Moving Average (EMA) – Gives more weight to recent price data, reacting faster to market changes.
Relative Strength Index (RSI)
- Measures momentum and determines whether an asset is overbought (>70) or oversold (<30).
Moving Average Convergence Divergence (MACD)
- Identifies trend reversals and strength by analyzing the relationship between two moving averages.
Bollinger Bands
- Measures market volatility, with prices often bouncing between the upper and lower bands.
Fibonacci Retracement
- Helps identify potential support and resistance levels using key Fibonacci ratios (0.236, 0.382, 0.618).
Analyzing Volume & Market Sentiment
Importance of Trading Volume
- High volume confirms strong price movements.
- Low volume during price increases may indicate a weak trend.
On-Balance Volume (OBV)
- Measures buying and selling pressure to confirm trends.
Fear & Greed Index
- A sentiment indicator that helps traders gauge market emotions.
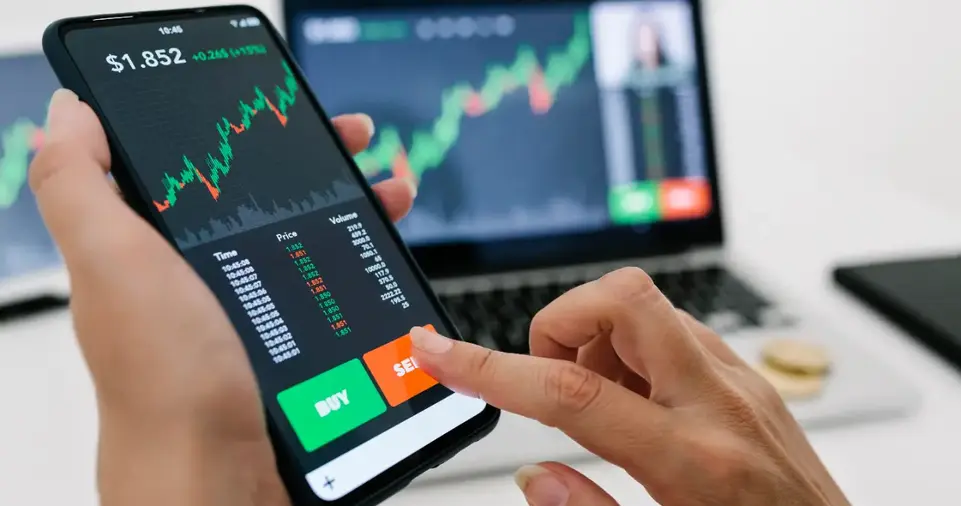
Setting Entry & Exit Points

Stop-Loss & Take-Profit Strategies
- Stop-Loss – Automatically sells an asset when it reaches a pre-set price to limit losses.
- Take-Profit – Automatically closes a position at a pre-set price to secure profits.
Risk-Reward Ratio
- Example: 1:3 risk-reward ratio means risking $100 for a potential profit of $300.
Using Multiple Timeframes for Better Analysis
- Short-Term (5min, 15min, 30min) – Best for day traders and scalpers.
- Medium-Term (1hr, 4hr) – Used by swing traders.
- Long-Term (Daily, Weekly, Monthly) – Ideal for long-term investors and position traders.
Staying Updated & Adapting Strategies
- Follow crypto news, regulatory updates, and global market trends.
- Adjust your trading strategies based on market conditions and news events.
Practicing with a Demo Account
- Before risking real money, test strategies on a demo trading account.
- Platforms like Binance, Bybit, and Kraken offer demo trading options.
Risk Management in Crypto Trading
Never Invest More Than You Can Afford to Lose
- Cryptocurrency markets are highly volatile; only invest money you’re willing to lose.
Diversification Strategy
- Spread investments across multiple cryptocurrencies to reduce risks.
Avoid Emotional Trading
- Stick to pre-defined trading strategies and avoid impulsive decisions.
ALSO READ: How to Research Topics for a Successful Blockchain Blog
Conclusion
Technical analysis is a powerful tool for cryptocurrency traders, helping them make informed decisions by analyzing historical price trends, trading volume, and market patterns.
By mastering key concepts like support and resistance levels, candlestick patterns, moving averages, and risk management techniques, traders can increase their chances of success in the crypto market.
However, no strategy guarantees profits, and continuous learning, practice, and discipline are essential for long-term trading success.
With the right tools, strategies, and market awareness, traders can leverage technical analysis to navigate the highly volatile world of cryptocurrency trading and maximize their potential profits while minimizing risks.


